Driving Insights
How to analyze and organize social media to your advantage

Let’s face it—social media can get a little overwhelming sometimes. A lot of thought goes into what you post, when you post it, and what platforms you should use. But are your posts making the impact you want?
It’s easy to tell how many likes a post has received or if you’re getting comments on your content, but what about more in-depth metrics? Knowing data points such as how many people viewed a post or clicked a link you’ve shared can help inform your approach to social media in the future.
Fortunately, the social media platforms used by most schools—Facebook, Twitter, and Instagram—all have robust analytics capabilities built right in. But making the most of this information starts with understanding what metrics to look for and what these numbers indicate. With that data in hand, you can begin pulling insights that will shape and inform your social media strategy.
Measuring Your Impact
Each platform has slightly different approaches to their analytics sections, but they all measure the same core set of information:
Followers: Your follower count is the number of people who’ve indicated that they want to see your posts in their individual feeds.
Impressions: Impressions measure how many times a post has been viewed in users’ feeds. It’s a quick—but imperfect—way to gauge how much traction your content is getting.
Reach: Reach measures the number of individual users who have seen your content. You may watch a funny cat video six times in a row (impressions = six), but you’re still the only one watching it (reach = one). One set of eyes equals one user reached but can account for multiple impressions.
Likes and Reactions: When most people think of measuring success on social media, they think of likes. This is simply a count of how many users have indicated that they, well, like your post. In recent years, Facebook, Instagram, and LinkedIn have added post reactions that allow a user to express sentiments other than “liking,” such as “crying,” “laughing,” or “angry.” This can convey specific reactions, as opposed to simple acknowledgement or appreciation.
A high number of likes—or reactions—may make your post show up higher in a user’s feed, but your likes count is not the end-all be-all of social media metrics. Other factors like comments and shares play a large role in the virality of a post, and depending on your objective, they may completely override likes as the primary metric to track.
Comments: Social media is meant to be a space for conversations. That’s why each individual post has space for comments (or replies on Twitter). The more comments you have, the more users are interacting with your content in some way.
That being said, not all comments are created equal. Sometimes people leave comments because they are angry about something or wish to lodge a complaint. That’s probably not the sort of engagement schools are looking for on social media, so it’s important to keep an eye on your comments and respond when necessary.
Shares: Are users sharing your content with their networks? That’s what your number of shares or retweets is measuring. Shares expand the reach of your school brand beyond your existing audience.
Link Clicks: This is less a measurement of your posts themselves and more a measurement of how many times users have clicked a link you’ve shared. This is an important metric to track if you’re using social media to promote a news story, a blog post, or your careers page. It’s good to know if people are not only seeing your posts, but actually taking the actions you want them to take.
Goals Over Metrics
Each of these metrics tells you something different about your performance on social media. Understandably, you might be tempted to dive into the numbers and fixate on certain measurements. Social media seems so much easier when you can hold up a single value, such as likes or followers, as an indicator of success.
However, likes, comments, and shares don’t really mean much on their own. These numbers can inform your approach to social media only when placed within the larger context of what you’re trying to accomplish on a given platform. Again, think about Facebook comments—if you have a lot of negative ones, a high number of comments isn’t necessarily a good thing.
It’s a common trap to become focused on one or two metrics and base success solely on whether those numbers are increasing or decreasing. But if you really want to be strategic when managing your accounts, you have to always think about the bigger picture. For example, having a large number of followers doesn’t tell you much about how well your audience knows you. Perhaps one popular post drove people to like your page, but your posts since then haven’t gotten nearly as much engagement.
Let your desired outcomes guide your metrics. If you want to increase the number of people keeping up with your schools (your brand awareness), track the number of followers you have and how many times your posts are shared. If, instead, your goal is to drive engagement with your content, you should drill into the posts that have the most likes, link clicks, and comments. The information you find could be valuable if you’re wanting to promote a bond election or another important event to your community.
The metrics that matter to you are specific to your district and could even change month to month depending on your larger goals. Viewing metrics in a vacuum doesn’t provide any context, and, more importantly, it doesn’t leave you with much insight for your future content strategy.
Making Sense of Your Metrics
Just as you shouldn’t obsess over your number of likes or impressions, you shouldn’t take a single popular Facebook post or tweet as a reflection of overall social media success. Look instead for patterns that reveal underlying trends. Perhaps your teacher appreciation posts consistently receive more engagement month to month than your other content. That’s a good reason to create and publish more posts highlighting not just teachers but your paraprofessionals as well. Finding patterns in how posts perform can teach you more than analyzing each post individually.
You also need to understand your posts in the context of how well your entire account is performing. Tracking your account performance can be as simple as benchmarking the metrics you’re interested in over time. Knowing how many new followers you gained on Twitter last month is helpful on its own, but it’s ultimately more meaningful to compare that number to your new follower count from previous months.
By studying your social media data at this level, you’ll better understand how your efforts are contributing to your larger goals. Social media platforms are just tools you can maximize to communicate better or build momentum behind an initiative. Don’t lose sight of the big picture when looking at account data.
Fine-Tuning Your Strategy
Sometimes, a particular post will gain far more traction with your audience than usual, and you won’t always be able to put your finger on why. These outliers offer a chance to experiment. Maybe you’ve noticed that posting to Instagram at 5 p.m. results in more engagement than at other times. That gives you some insight into when your audience checks their Instagram feeds. If you never experiment with how and when you post, you could miss these sorts of insights.
Finding out what content performs best with your audience may take some experimentation, too. In some cases, it could be district announcements; other times, updates from athletics or other extracurricular events could perform best. It’s only by digging into post-level insights that you’re able to see what’s resonating and what’s not.
A great example of this is better understanding what types of media get the most engagement. It’s generally understood that videos perform better than static images, but is that true in your context? Whatever you find, these types of insights can be invaluable as you continue to formulate and tweak your approach to social media.
Ultimately, the value of your social media insights depends on your overall strategy. Once you know what you want your posts to achieve, social media metrics can tell you whether or not you met your desired outcome.
If your accounts haven’t performed as well as you hoped, no sweat! Those same insights can inform how you adapt and change your approach going forward. You probably won’t ever feel like you’ve mastered social media—and that’s okay. Iteration is the name of the game, and that allows a lot of room to find an approach that fits your unique school community.
Accessing Your Metrics by Platform
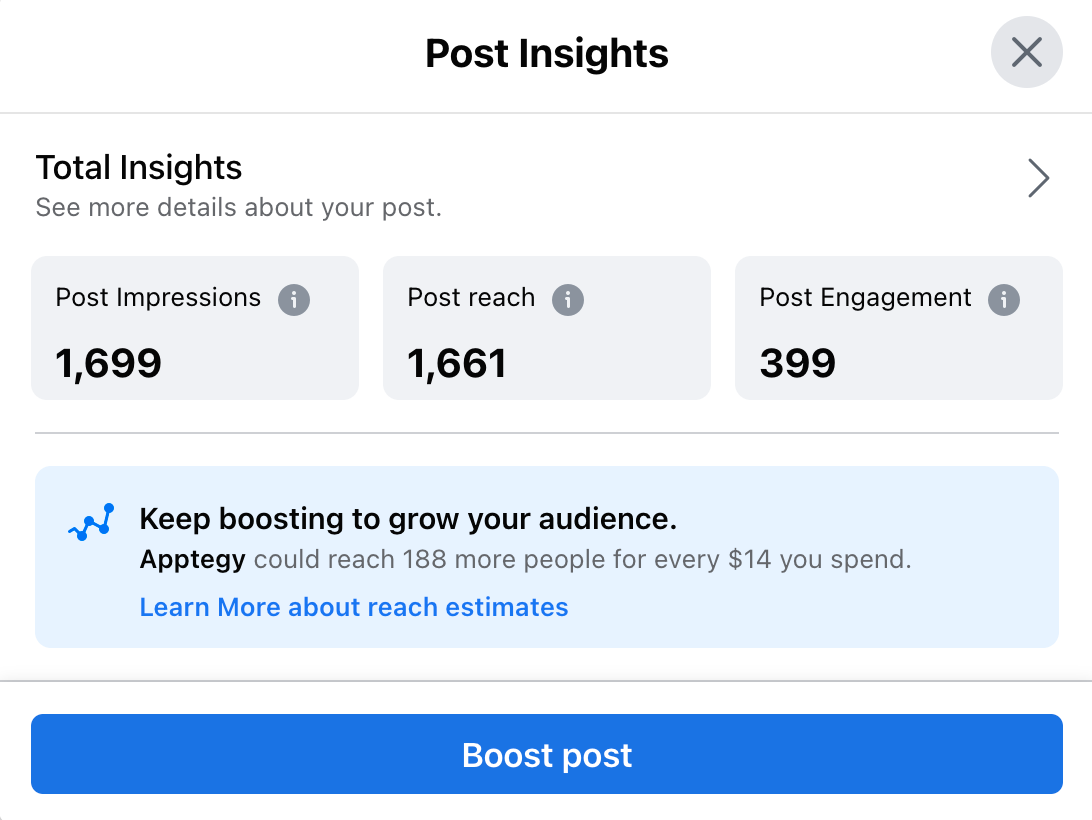
You should always create a Facebook Page—not a profile or group—for your district. On a Page, administrators will be able to see advanced metrics for reach and impressions for each post, not just likes and comments. Click on "See insights and ads" to see these insights.
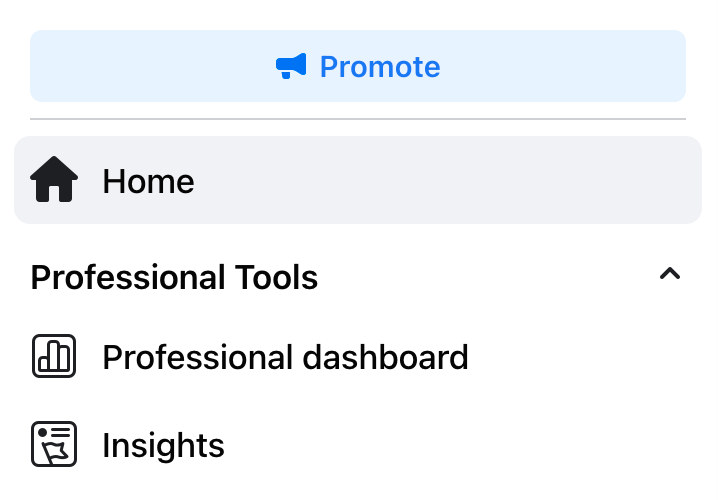
In order to view Page-level metrics, you’ll need to access the “Insights” section located in the sidebar on the left (under "Professional Tools") when you’re viewing your page.
This section allows you to track metrics such as Page views, post reach, and more across time—specifically the last 28 days. In addition, you’ll find data detailing your overall post engagement and page likes.
Every tweet you send will have a button underneath called "View Tweet analytics" that looks like a bar graph.
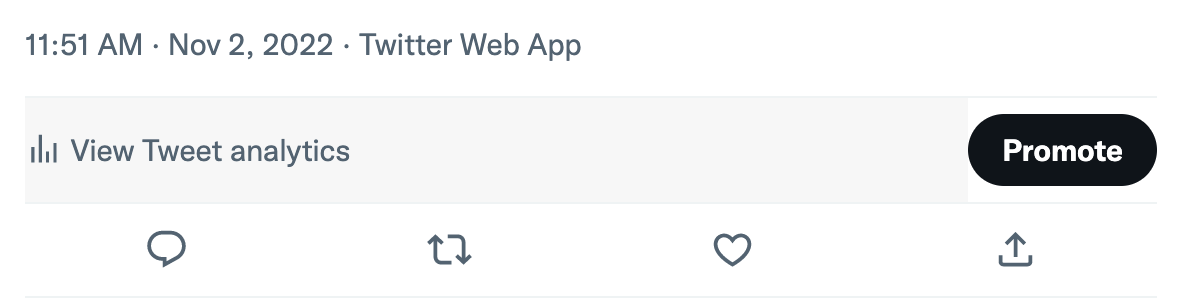
This button will allow you to see detailed information about how users have engaged with that specific tweet.
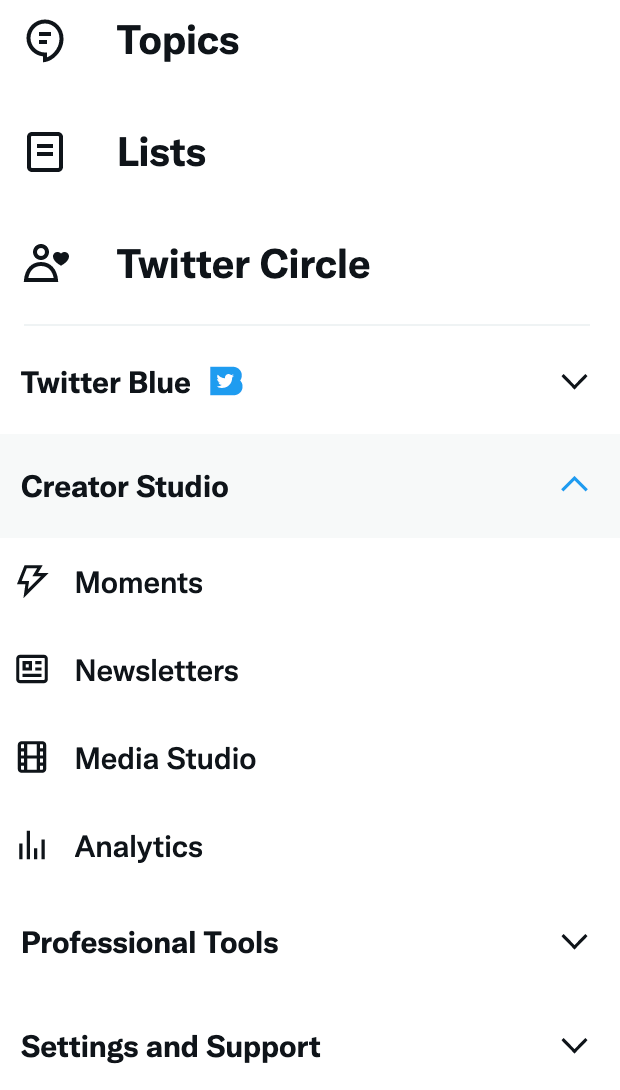
In order to see account-level insights, you’ll have to click on the “More” button (on desktop) in the lefthand menu, find the "Creator Studio" button, then click on "Analytics."
Once there, you can find data for your account broken down in a 28-day summary as well as a month-by-month view that highlights top tweets and provides information about overall account performance.
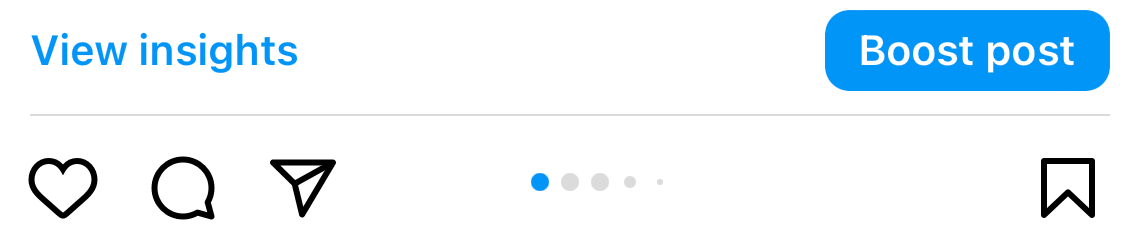
You can only see advanced metrics on Instagram if you have a Business Account. On the Instagram app, there is a button under each post called “View Insights”—this button will lead you to more detailed stats for that post, such as reach and post-generated profile visits.
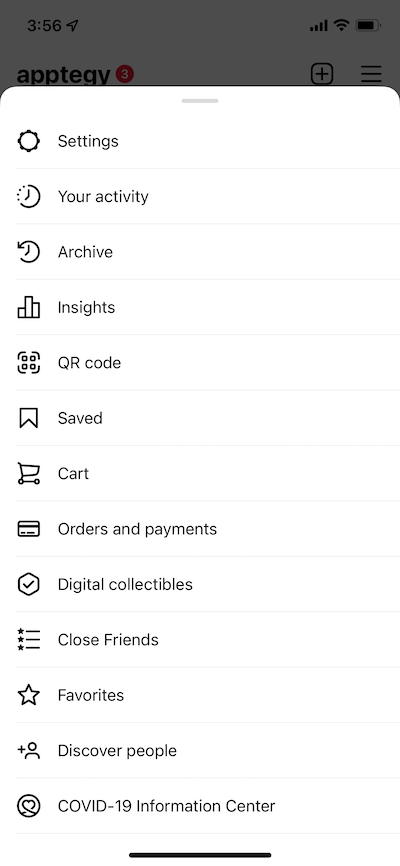
In order to see metrics for your entire account, click on the “Menu” button, then “Insights.” The “Insights” page can also be accessed under your bio if you click the "Professional dashboard" button. The Insights section allows you to filter your account metrics over specific date ranges.
Taken all together, you’ll be able to accurately track how your accounts are performing both on a per-post basis as well as over time. Once you know which metrics to prioritize given your current strategy, you’ll be well on your way to turning these insights into actionable next steps.
![]()
SchoolCEO is free for K-12 school leaders. Subscribe below to stay connected with us!